Our official winter outlook will be issued Tuesday, November 28th at 7pm EST!! The outlook will be aired live through our online webinar. There is a maximum attendance limit of 500 people, so make sure you register now by clicking the link here: bamwx.com/webinar.
We also have our LIGHTNING WEEK SPECIAL coming up soon and you can receive 30% off our services! If you have been hesitating to sign-up, now is the time to do so!

Today we wanted to focus on the developing “La Niña” across the equatorial Pacific and its impacts on winter weather.
First off, let’s take a look at how the sea-surface temperatures have trended across the Pacific Ocean to evaluate our ENSO status. Note the continued cooling of waters off the west coast of South America, extending west through much of the equatorial Pacific from July to now. That is the La Niña developing.
What is interesting about the Pacific sea-surface temperature configuration is that the “coolest” waters are found in the eastern equatorial Pacific off the coast of South America….we call this an east-based La Niña.
The equatorial Pacific is divided into different ENSO regions. The most commonly used region is 3.4.
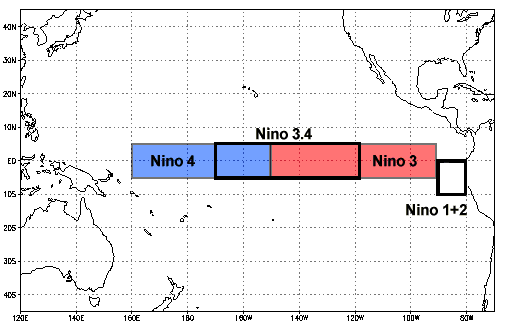
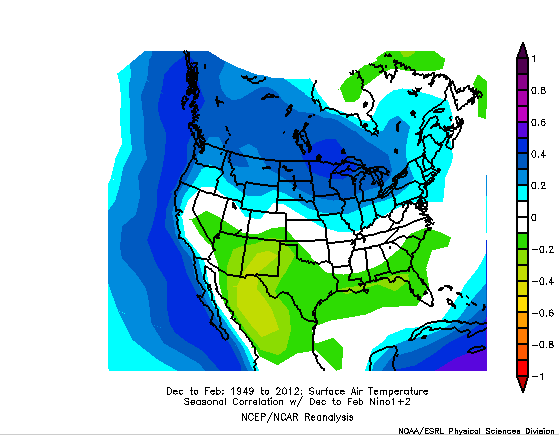
With the strongest cooling in Nino 1+2 regions (off the coast of South America), our team took a look at what correlation the Nino 1+2 region has to surface temperatures in the United States during December-February. We find a moderate positive correlation in the northern U.S., and a negative correlation in the Deep South and southwestern U.S. Note that a positive correlation means that as the waters in Nino region 1+2 cool, we also tend to see cooler than normal temperatures, and vice-versa. We flipped the color table to illustrate the temperature correlation on the map below. That’s a cooler than normal temperature correlation for the northern U.S., and warmer for the Deep South and desert southwest.
Our team researched years that featured a similar sea-surface temperature configuration to what we are seeing now in the equatorial Pacific. Check out temperatures from normal during these winters:
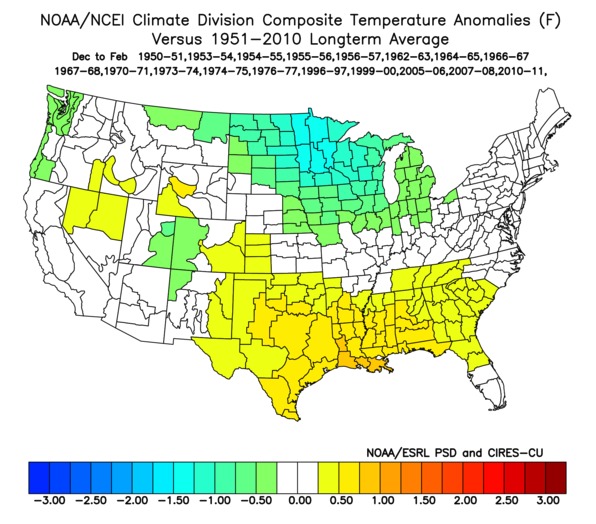
See a relationship between the correlations map and the actual outcome during these years? Note the cooler than normal temperatures in the north, and warmer conditions to the South.
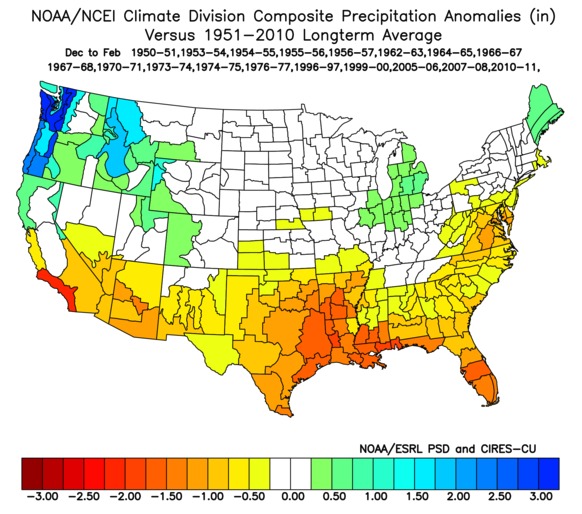
Here is what precipitation from normal looked like during years. Note the active Pacific Northwest, overall wetter signal in portions of the Ohio Valley, with drier than normal conditions south. This is what we normally see during a La Niña winter.
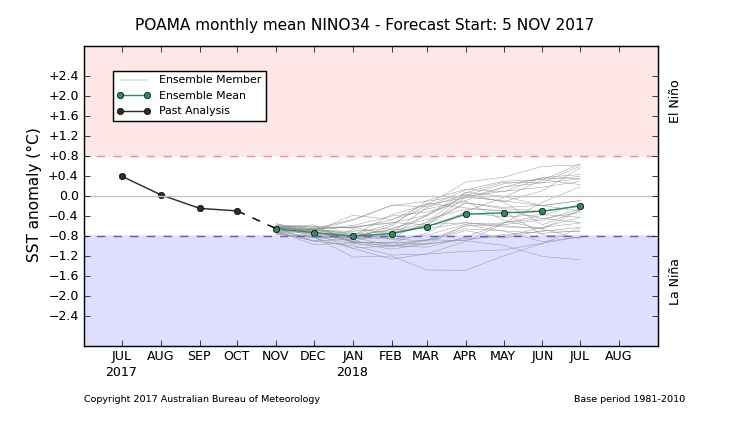
Latest model guidance continues to suggest we remain in a weak La Niña during the winter, before trending neutral next spring.
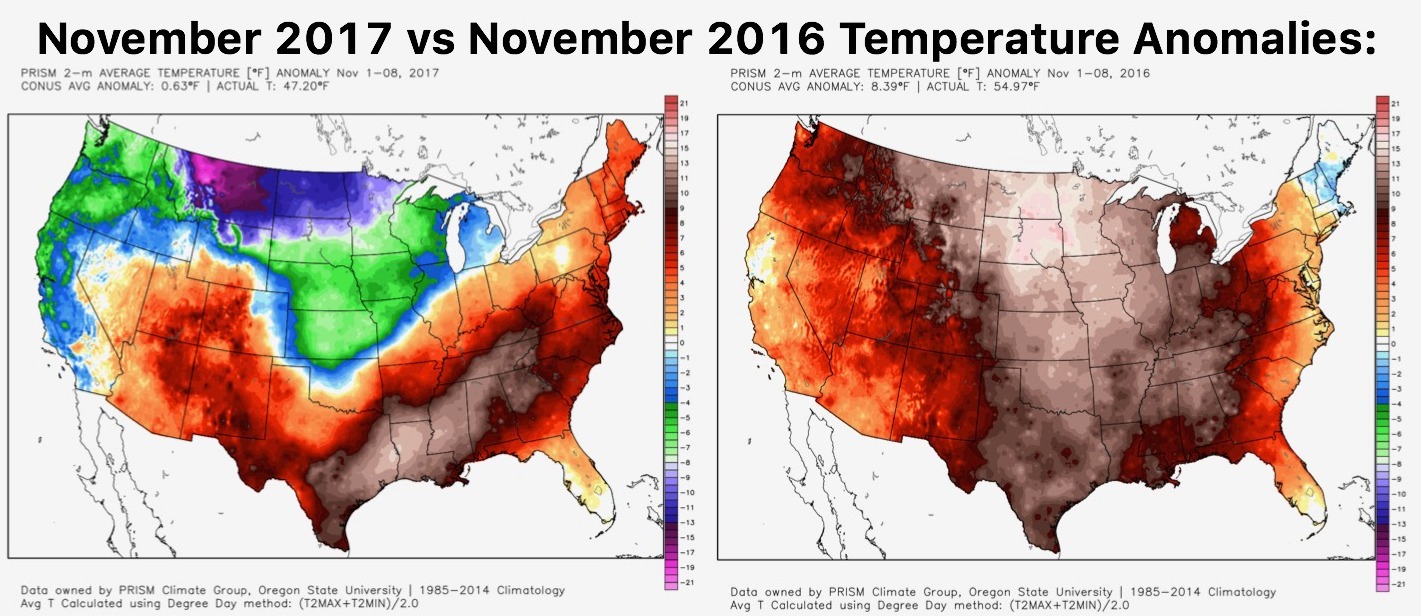
We are already seeing some very cold air across Canada and the northern U.S., with winter getting to a quick, early start in the northern Plains and southern Canada. Check out the difference in temperatures from normal November 1-8 of this year vs. last year….MAJOR differences across the upper Midwest! Last November started out incredibly warm.
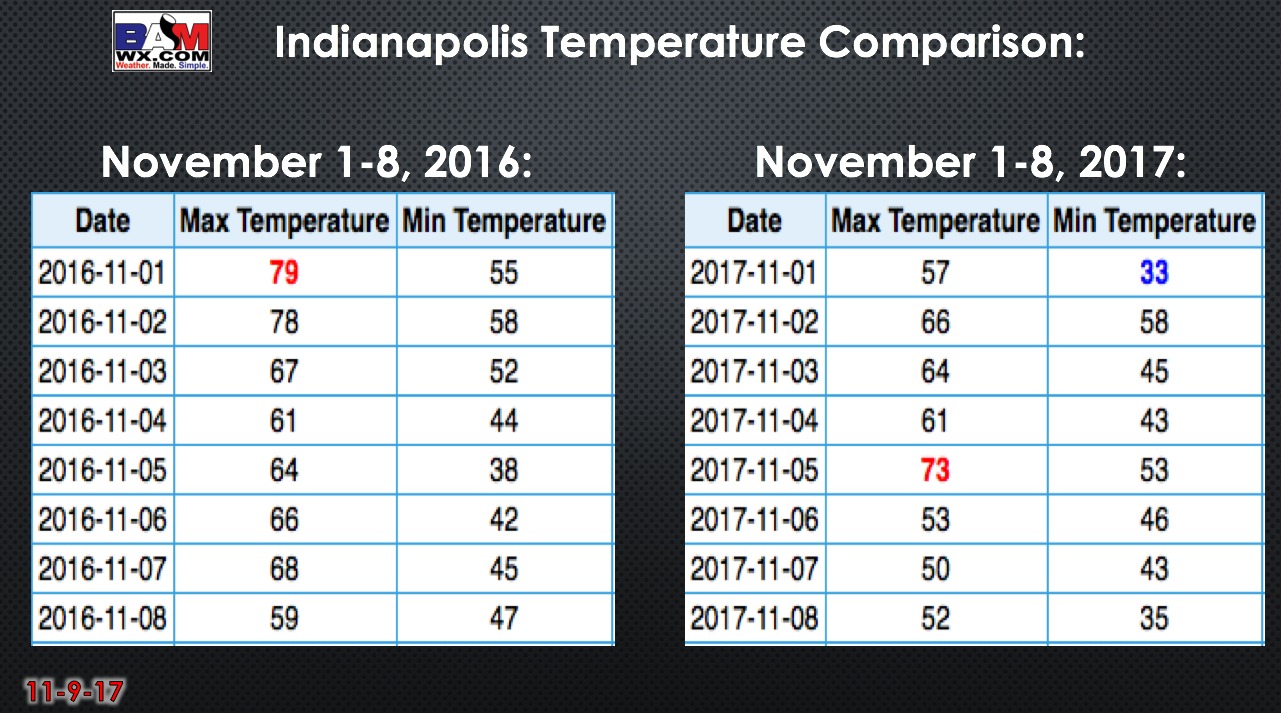
For a local perspective, here is a look at observed temperatures in Indianapolis for November 1-8, 2016 vs this November:
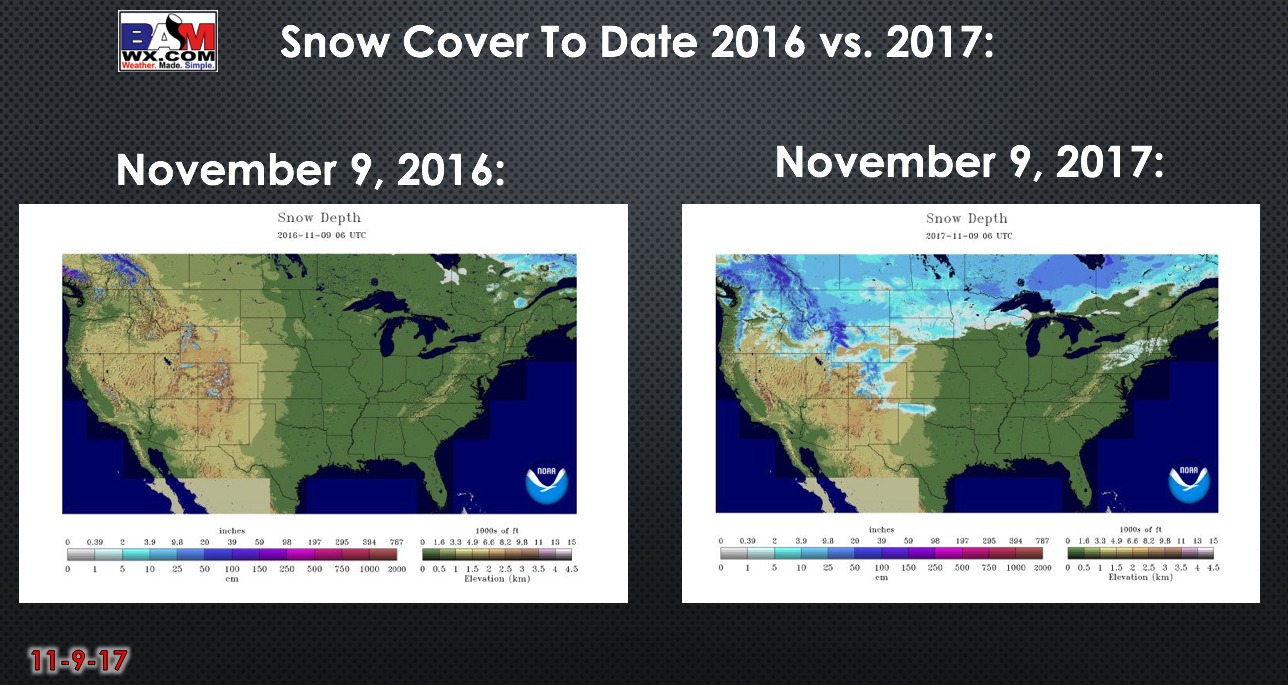
We are also seeing a rapid increase in snow cover across North America. Currently 22.6% of the U.S. is covered in snow. Compare that to 0.6% on the same date last year!
The bottom-line is that we continue to see an east-based La Niña developing, and we typically find more active and colder conditions in the northern U.S., while the Deep South and Southwest U.S. usually stay drier and warmer during the winter months. We are already seeing a pattern evolution of a La Niña across the U.S. We hope you found this blog interesting and useful. Don’t forget our official winter outlook will be issued on November 28th at 7pm EST!! If you want to see it, sign-up here: bamwx.com/webinar. Inquire: [email protected] if you have any questions. Have a great day!
Nathan Kitchens
Twitter: @natewx