Our official winter outlook will be issued Tuesday, November 28th at 7pm EST!! The outlook will be aired live through our online webinar. There is a maximum attendance limit of 500 people, so make sure you register now by clicking the link here: bamwx.com/webinar.
We also have our LIGHTNING WEEK SPECIAL coming up soon and you can receive 30% off our services! If you have been hesitating to sign-up, now is the time to do so!

In today’s blog we are going to discuss the latest trends regarding the winter pattern including a look at the PDO (Pacific Decadal Oscillation) and how that drives the winter pattern and updated model trends.
The Pacific Decadal Oscillation involves the temperature profiles of the central and eastern Pacific. This weather pattern indicator is easier to track since it tends to remain in the same phase for 20-30 years, while ENSO events (El Niño/La Niña) tend to only last 6-12 months. It is considered a “positive” phase when we note warm waters along the west coast of the U.S. into Alaska, and a large area of colder than normal waters over the northern Pacific. It is considered a negative phase when we find colder than normal waters along the the west coast of the U.S. into Alaska, and warmer waters further west over the north Pacific.
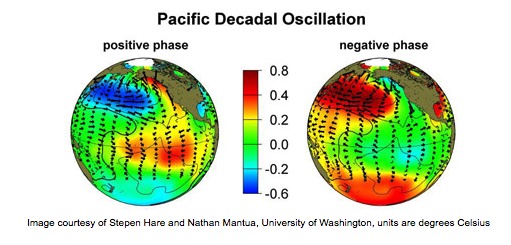
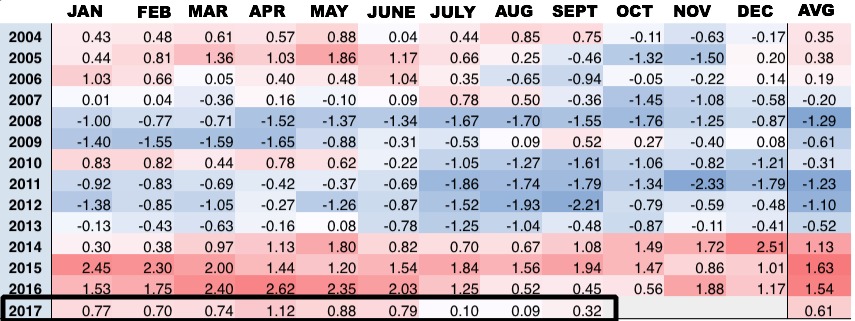
Why does the PDO matter? This is a very important pattern driver to look at because different positions of warm/cold waters in the Pacific will change the location of the jet stream, and as a result, can impact the weather around the globe. The PDO values have generally been positive this year, but declining to around neutral since July.
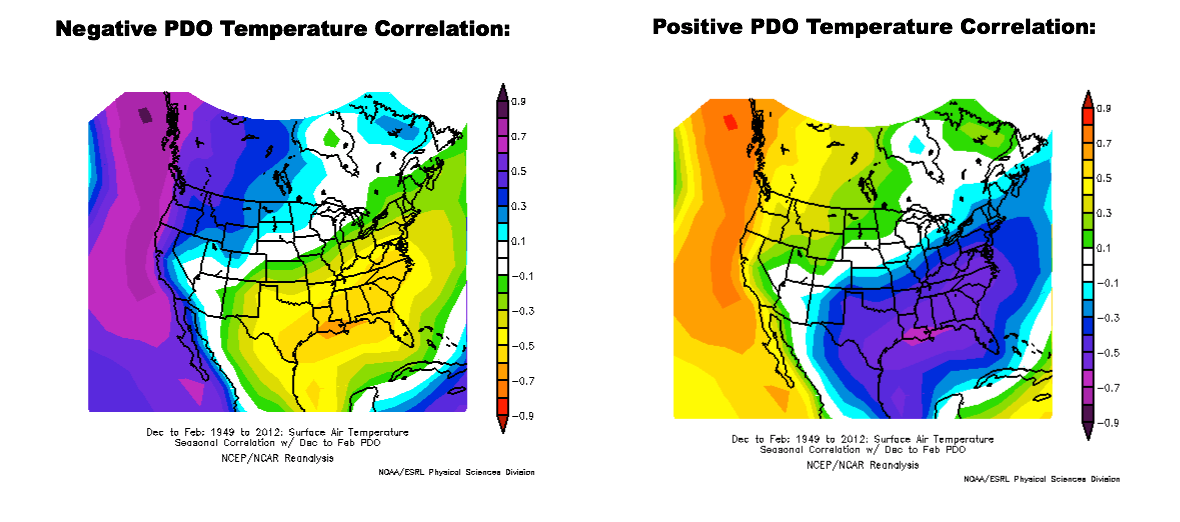
Looking at the correlation of PDO to surface temperatures in December-February, we find that the PDO has a strong correlation to temperatures across the U.S. during December-February. The negative phase correlates to warmer temperatures in the southern and eastern U.S., with cooler temperatures in the northwest. A positive phase leads to the opposite.
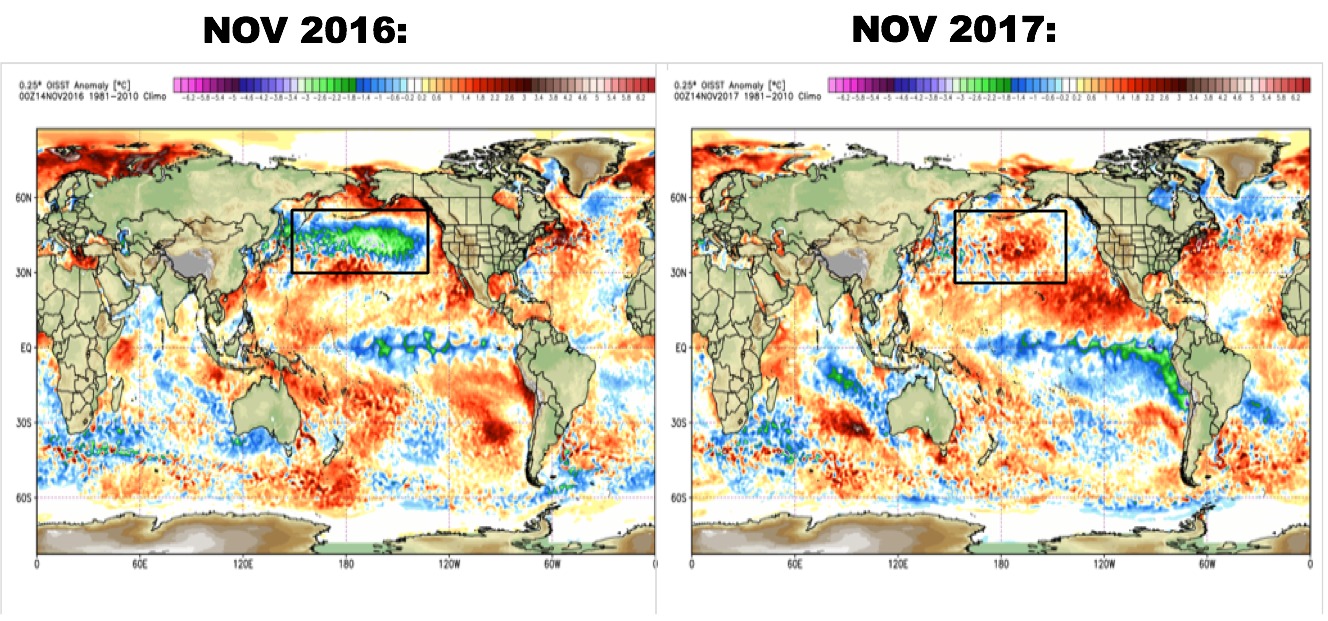
Looking at current sea-surface temperatures, we find warmer than normal ocean temps in the west-central North Pacific, with relative cooler waters off the Pacific Northwest. The main take-away here is that regions of warmer waters can lead to higher pressures and ridging in the jet stream, with a downstream trough. Remember the jet stream is analogous to a water bed. When you press up on one end, the other end (downstream) is forced down. In the graphic below, note big differences in the North Pacific waters from last year to this year:
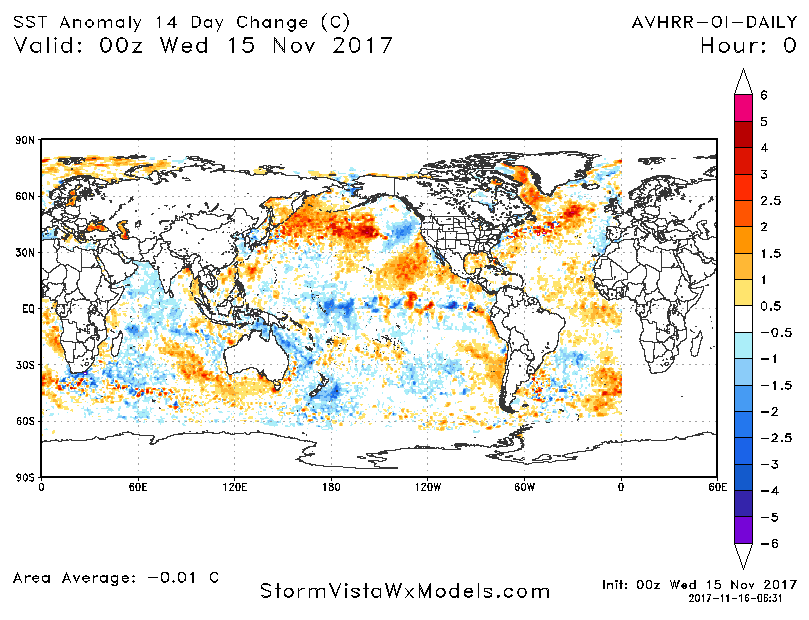
What is interesting is the 14-day change in sea-surface temperatures. Note the increasing warmth of the North Pacific Ocean temperatures.
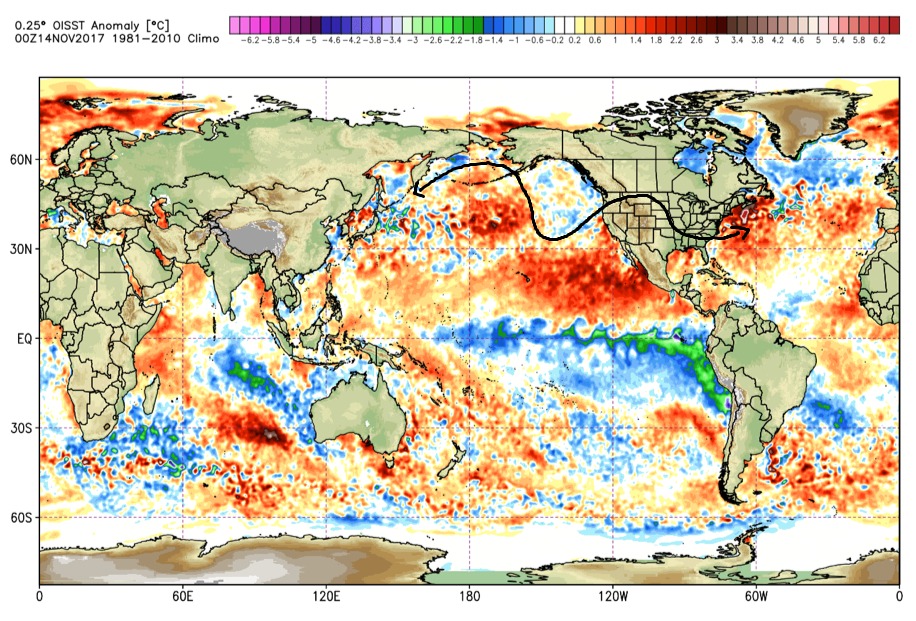
If we were to draw out the current implications of the developing warm “blob” in the North Pacific, we find a ridge building over that area, and a downstream trough extending into the Pacific Northwest, ridge over the southwestern U.S., and a trough in the eastern U.S.
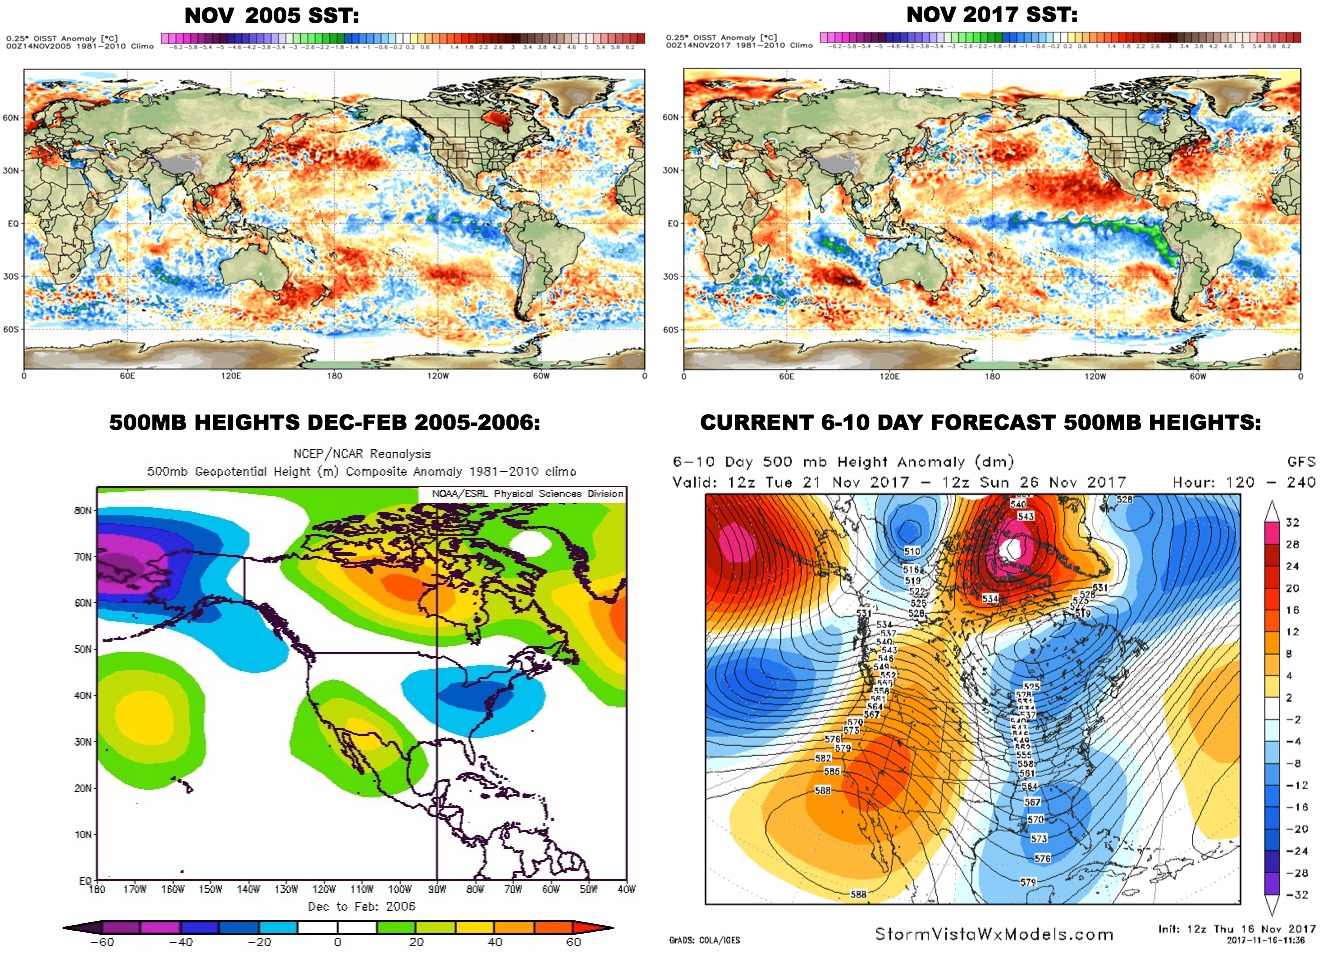
Looking at past years, we find a lot of similarities in the North Pacific sea-surface temperatures to this year. Interestingly, we find some similarities from the overall pattern that winter to the current pattern evolving, with some high latitude blocking allowing for troughs (cold) to lock into the eastern U.S. and ridging (warmth) in the southwest U.S. 2005-2006 is on our analog forecast for this winter as that year also featured an east-based La Niña and a negative QBO (discussed in previous blogs) similar to this year.
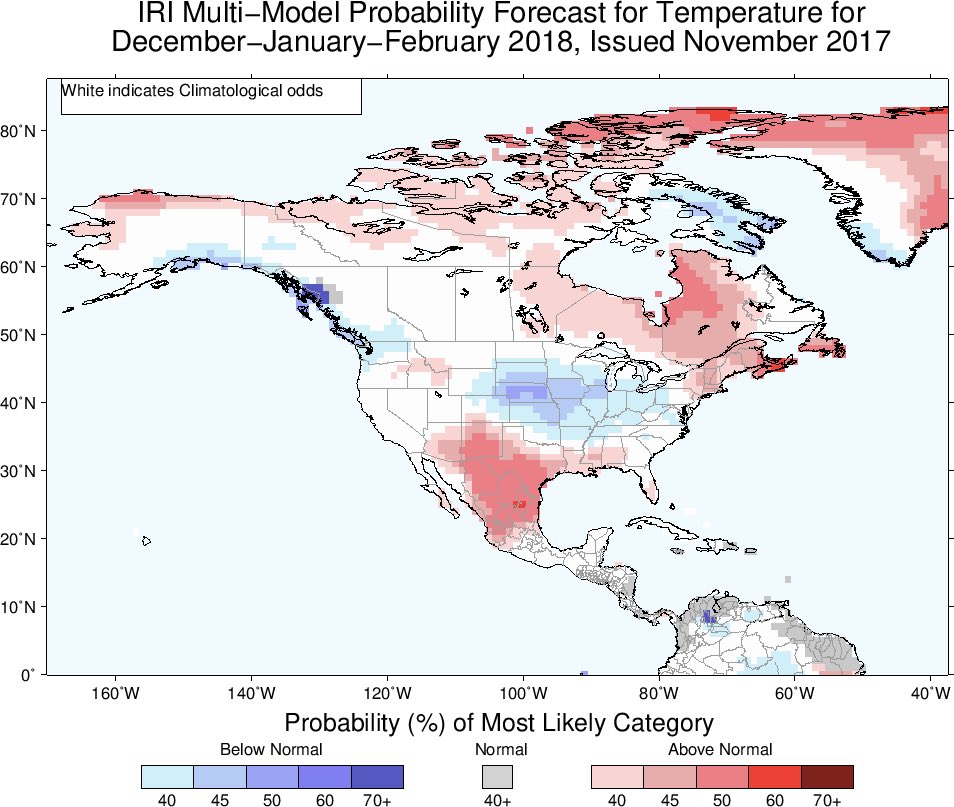
Let’s take a look at what some new model data is showing for winter. The updated IRI multi-model probability forecast is showing higher probabilities for cold across much of the central U.S., with above normal temperatures across southwestern U.S. and portions of New England. If we can continue to maintain blocking in the high latitudes (towards the North Pole and Greenland) that will increase the threat for expanding cold into the U.S. If you are a lover of cold and snow, this model is very encouraging!
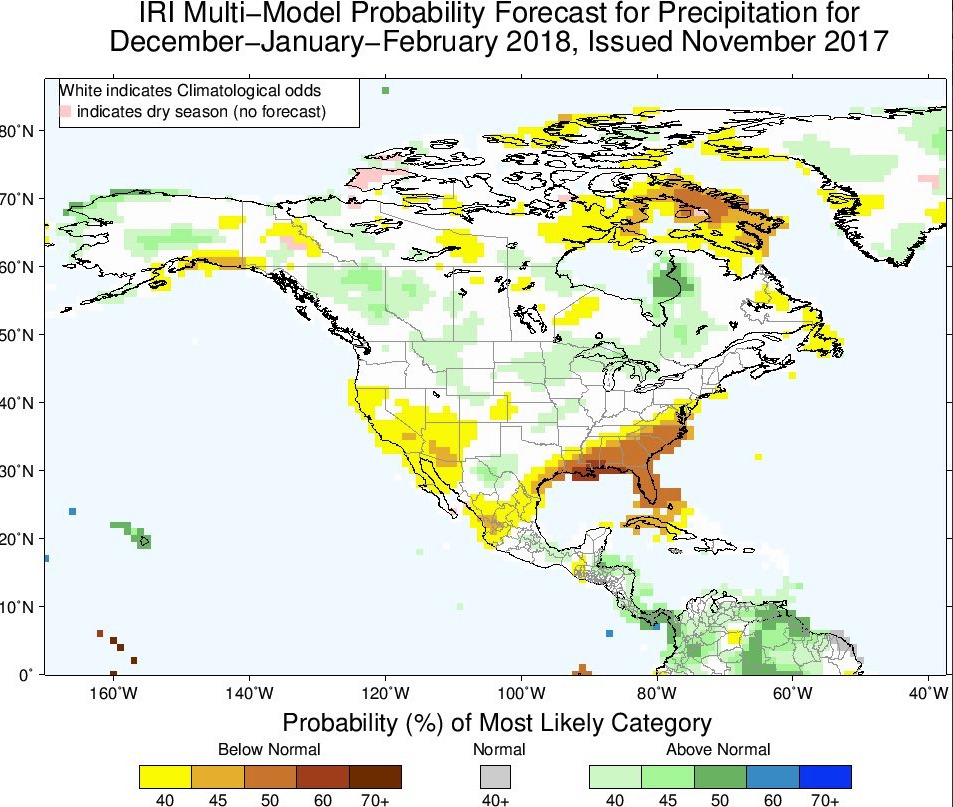
The precipitation probability forecast for December-February has quite a La Niña look with an active pattern in the central and northern U.S., with dryness across the southeast U.S. as well as the southwest.
You do not want to miss our official winter outlook coming up on November 28th at 7PM EST! In order to watch it, you must sign-up! LINK: bamwx.com/webinar There is a limit of 500 people so be sure to sign-up asap!
-Meteorologist Nathan Kitchens