Good Monday afternoon! Here is the latest winter threat blog. These will be issued for free this entire winter. These are just broad discussions of the winter pattern and the main drivers behind it. For a daily detailed analysis, inquire at [email protected].
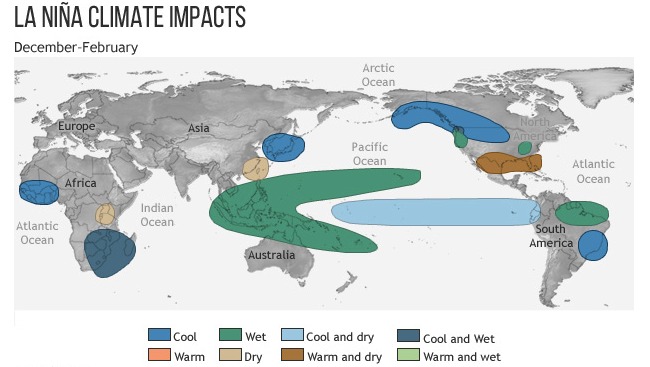
During the month of September, NOAA issued a La Niña WATCH with a 55-60% chance of La Niña developing during the upcoming winter. In our previous blogs, we have discussed our thinking of a weak La Niña in play this upcoming winter. First off, what kind of weather does a typical La Niña bring during the winter? We tend to see drier and warmer than normal conditions along the Gulf coast states, cooler and and wetter than normal conditions in the northern U.S. as well as a wet signal through the Ohio Valley region with an active Pacific jet stream. Important to note that no two La Niña events are the same.
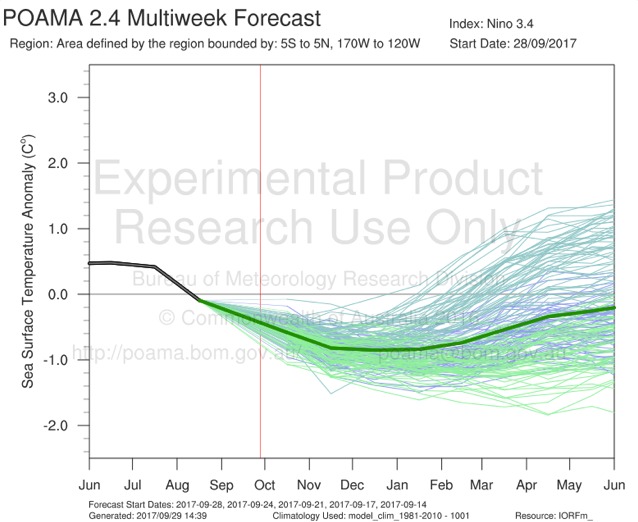
Latest model guidance continues to suggest weak La Niña conditions for the upcoming winter. Anything below 0.5ºC in ENSO region 3.4 for a 90 day period constitutes as a weak La Niña.
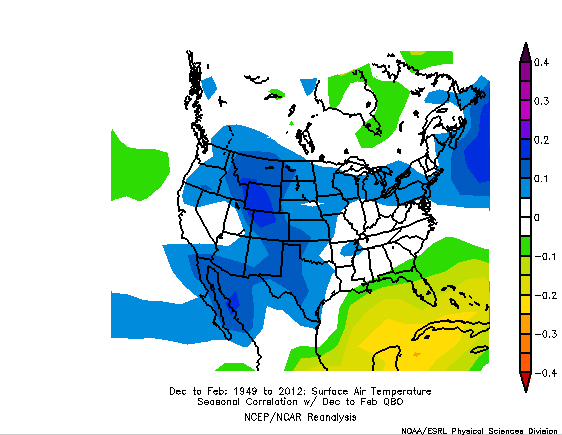
We have also discussed that the QBO (Quasi-Biennial Oscillation) continues to trend moderately negative. The main take-away is that when this phase is negative, it often results in more sudden stratospheric warming events that displace the polar vortex and send arctic shots of air into the mid-latitudes. When the QBO is positive, the polar vortex tends to be stronger which usually leads to less intrusions of arctic air into North America (think 2016). Looking at a negative QBO’s correlation with surface air temperatures, we find a signal for cooler than normal temperatures across the northern and western U.S., and a warmer signal along the Gulf coast.
We also look at AAM (Atmospheric Angular Momentum) which (simply put) measures the extent of whether the atmospheric background is more favorable towards La Niña or El Niño based on the degree to which the Earth’s rotation is slowed or increased from “surface drags” caused by atmospheric conditions such as pressure/wind systems. When this value is negative, we find a more La Niña-like background state of the atmosphere. When this value is positive, we find more El Niño-like conditions around the globe. When we look at what a negative AAM value correlates to regarding temperatures, we find a correlation to colder than normal temperatures in the northern U.S., with warmer conditions along the Gulf Coast states.
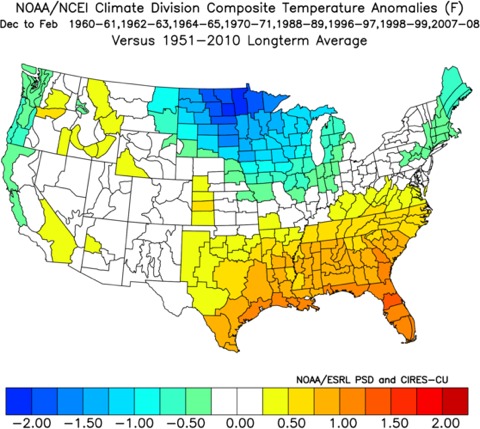
Here is an interesting analog which shows what past winters featured temperature-wise based off following winters with similar AAM behavior to what we are observing now. Again, favoring the northern U.S. for below normal temperatures.
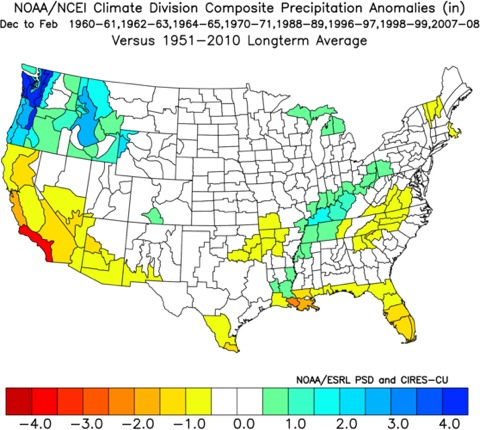
Here is what precipitation was like in these years (note the above normal precipitation through the Ohio Valley).
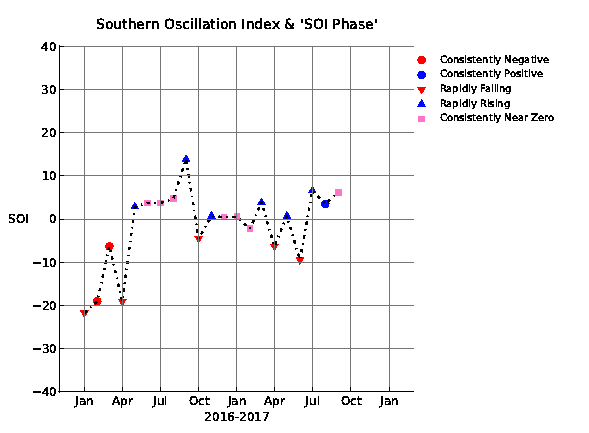
We can also take a look at the SOI (Southern Oscillation Index) which is an index that measures the difference in air pressure between the island of Tahiti and Darwin, Australia. This is a key index for gauging the strength of El Niño and La Niña. Consistent negative values constitute El Niño conditions which coincide with warmer than normal sea surface temperatures in the eastern tropical Pacific, while consistent positive values are representative of La Niña conditions with cooler than normal sea surface temperatures in the eastern tropical Pacific. Looking at the graph below, we can see the SOI values have been overall positive since late June:
Here is a map showing the correlation between a positive SOI and temperatures during the winter. We find this correlates to cooler than normal temperatures in the northern U.S., meanwhile warmer in the southern U.S. (notice a trend here?)
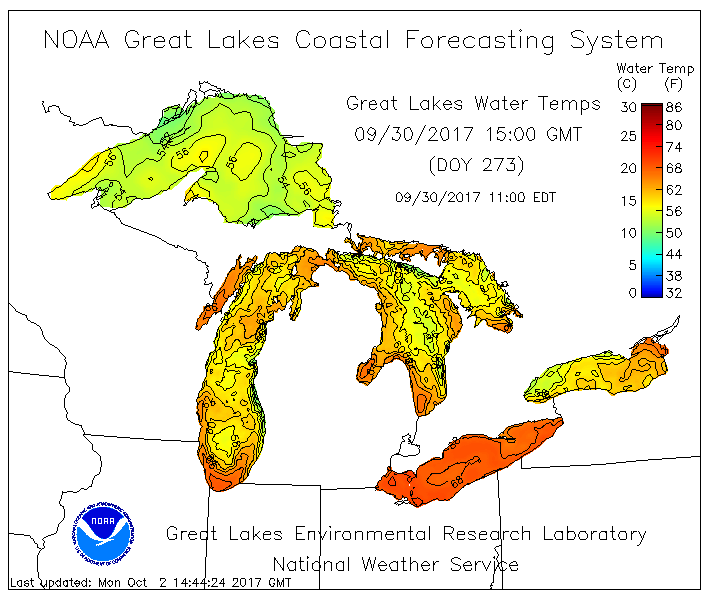
One last note, our recent late September heat wave really allowed the Great Lakes to become quite warm. These warmer than normal waters could spell an active lake-effect snow machine this year given favorable cold air masses blowing over those warm waters. This is something we need to keep in mind heading deeper into fall.
That is just a glimpse at some of our research into the winter forecast. We believe our extensive time spent researching the pattern is what makes our forecast different from the competitors, versus strictly looking at long-range model data which tends to be very inaccurate several months out. We hope you found this interesting and useful. Have a great day!